Observed operations
Explicitly mark checkout, reporting, or any workflow worth understanding.
Mark the operations that matter. Sightglass shows what happened, why it failed, which database or outbound call was slow, and what each customer used—without collecting everything else.
One container. Explicit SDK calls. Your infrastructure.
export const checkout = observe("checkout", async () => {
  observe.set({ tenantId, plan: "pro" });
  const order = await observe.step("create-order", createOrder);
  observe.meter("orders.created", 1, { tenantId });
  return order;
});Official marks identify supported integrations; no affiliation implied.
A deliberately narrow model
Explicitly mark checkout, reporting, or any workflow worth understanding.
See Prisma cost inside the operation that caused it.
Record exact idempotent product usage with execution context.
Bodies, headers, cookies, SQL, and bind values are never captured automatically.
The answers are already connected
Sightglass keeps business context beside runtime evidence, so you can investigate without stitching together logs, traces, and billing exports.
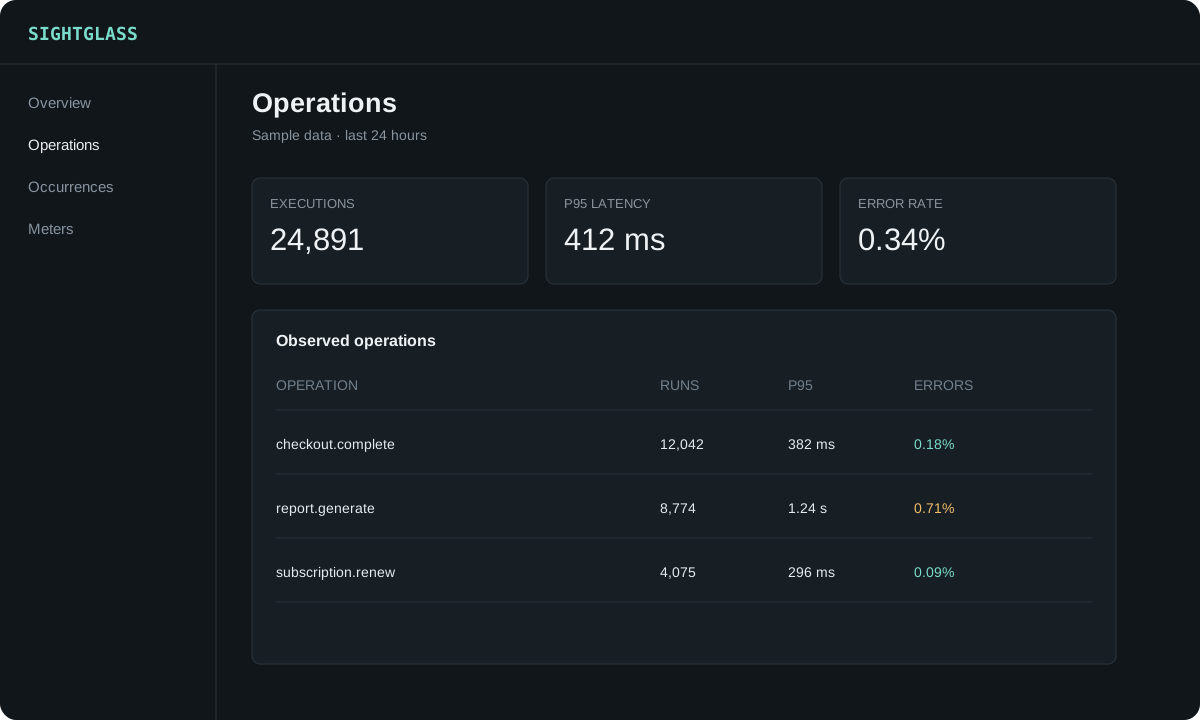
Know where to look
Compare volume, tail latency, and errors without building queries or maintaining dashboards.
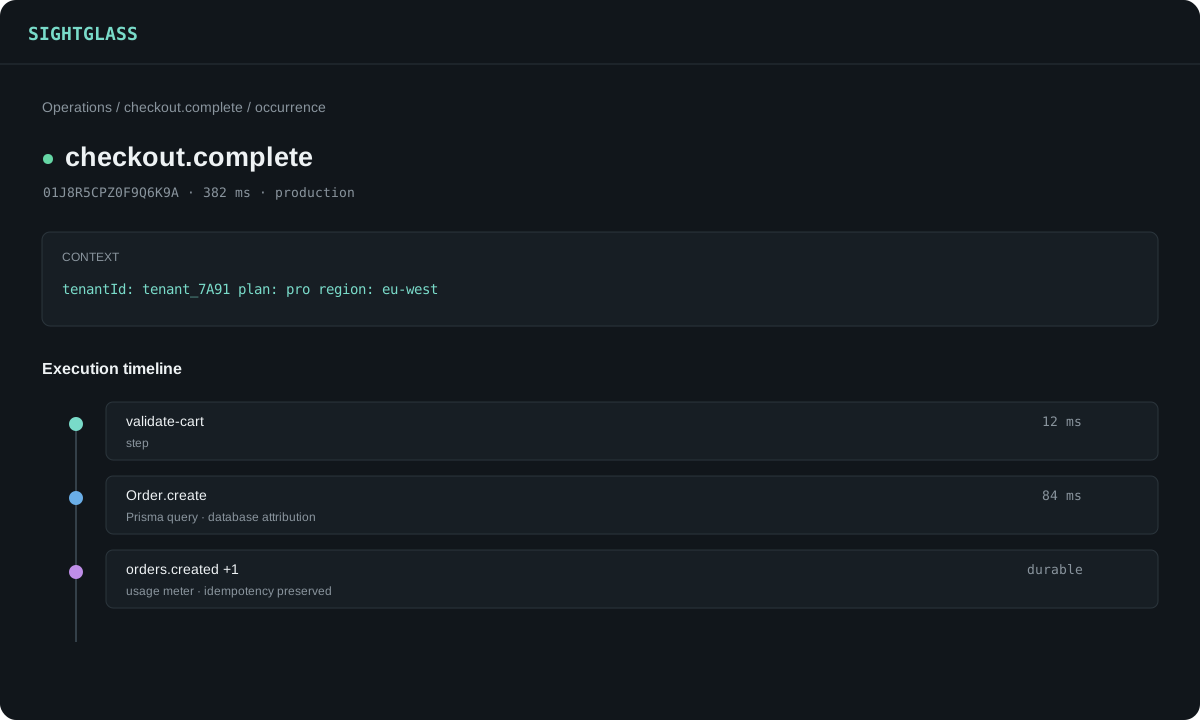
Explain what happened
See bounded business context, steps, database work, outbound calls, events, and the final outcome in execution order.
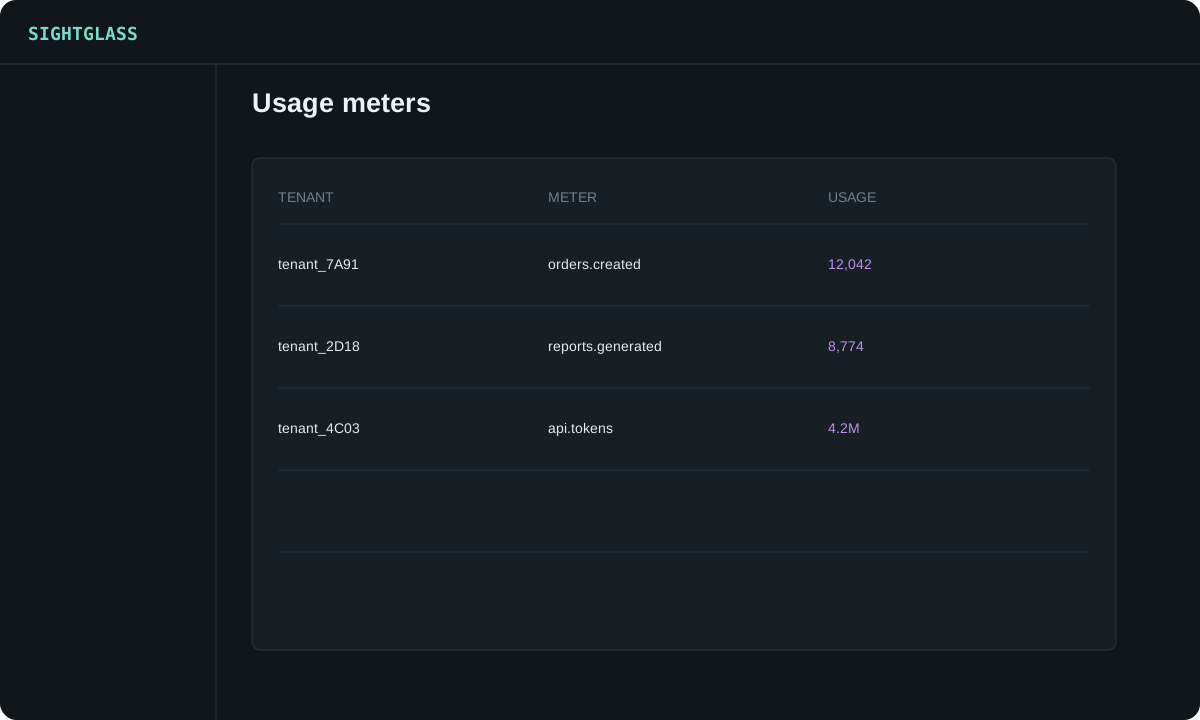
Meter with evidence
Use idempotent meters for billing and limits, then move directly from an aggregate to its supporting executions.
Product renders use representative sample data.
Deliberately opt-in
Unwrapped work stays invisible. Add bounded business context, meaningful events, steps, database attribution, outbound calls, and usage only where they matter.