Evidence
Reproducible benchmarks
Interpret and reproduce Sightglass ingestion, query, and storage measurements.
The benchmark suite builds the real server, creates isolated temporary databases, and records raw samples before generating summary tables and SVG charts. It measures HTTP ingestion, representative dashboard queries, and SQLite storage footprint.
The current reference was measured 12 September 2026 on Node.js 24.18.0, Windows x64, an Intel Core i5-10300H with 8 logical CPUs, and 16 GB RAM.
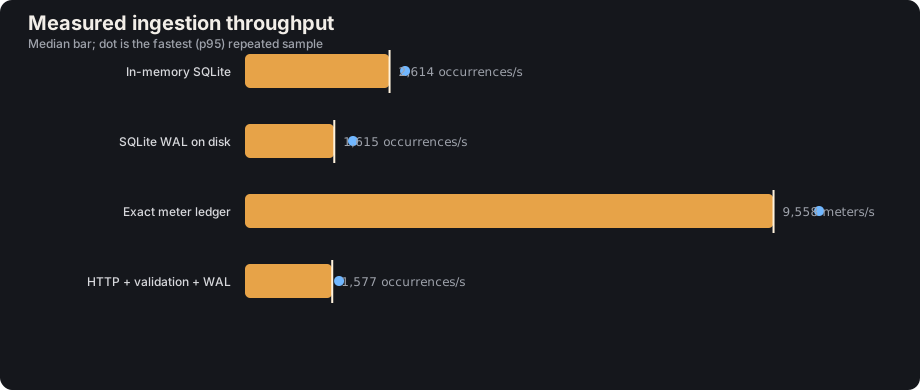
| Path | Median | p95 sample |
|---|---|---|
| In-memory SQLite ingest | 2,713 occurrences/s | 2,833 occurrences/s |
| SQLite WAL ingest | 2,301 occurrences/s | 2,437 occurrences/s |
| Exact meter ledger | 8,867 meters/s | 10,357 meters/s |
| HTTP + JSON + validation + WAL | 1,586 occurrences/s | 1,758 occurrences/s |
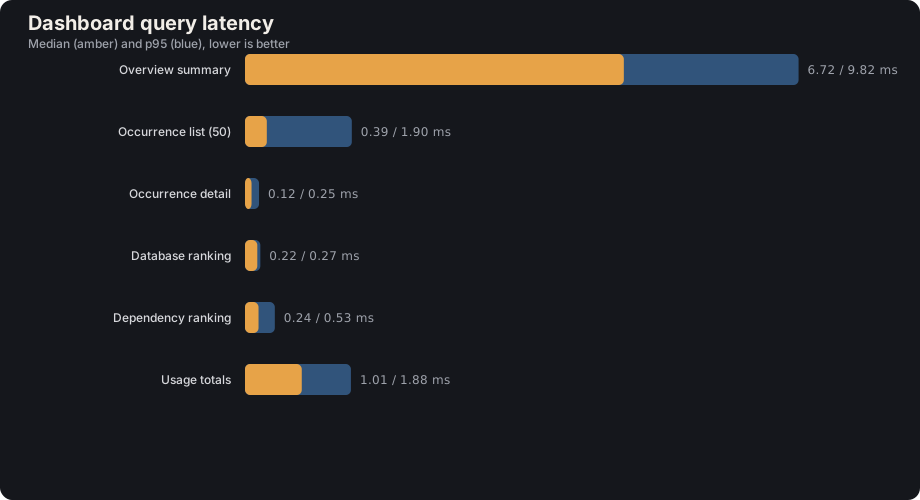
| Dashboard query over 25,000 operations | Median | p95 |
|---|---|---|
| Overview summary | 5.81 ms | 11.52 ms |
| Occurrence list | 0.36 ms | 0.50 ms |
| Occurrence detail | 0.06 ms | 0.23 ms |
| Database ranking | 0.22 ms | 0.27 ms |
| Dependency ranking | 0.24 ms | 0.32 ms |
| Usage totals | 0.97 ms | 1.54 ms |
Run it from the main source repository:
npm run benchmark
The checked-in evidence is a regression reference, not a universal capacity promise. Results depend on CPU, filesystem, container limits, payload shape, cardinality, retention, and concurrent application traffic. Load-test with production storage and resource limits before sizing a deployment.
The machine-readable result includes every raw sample, descriptive statistics, settings, and environment details.